A FIFO fills up, some samples are lost, and a perfectly plausible echo remains on the screen. The firmware can still find a peak above the threshold and report an indication: the peak exists, but the acquisition is incomplete. This is a case where digital electronics, embedded software and signal analysis need to share the same understanding of the data.
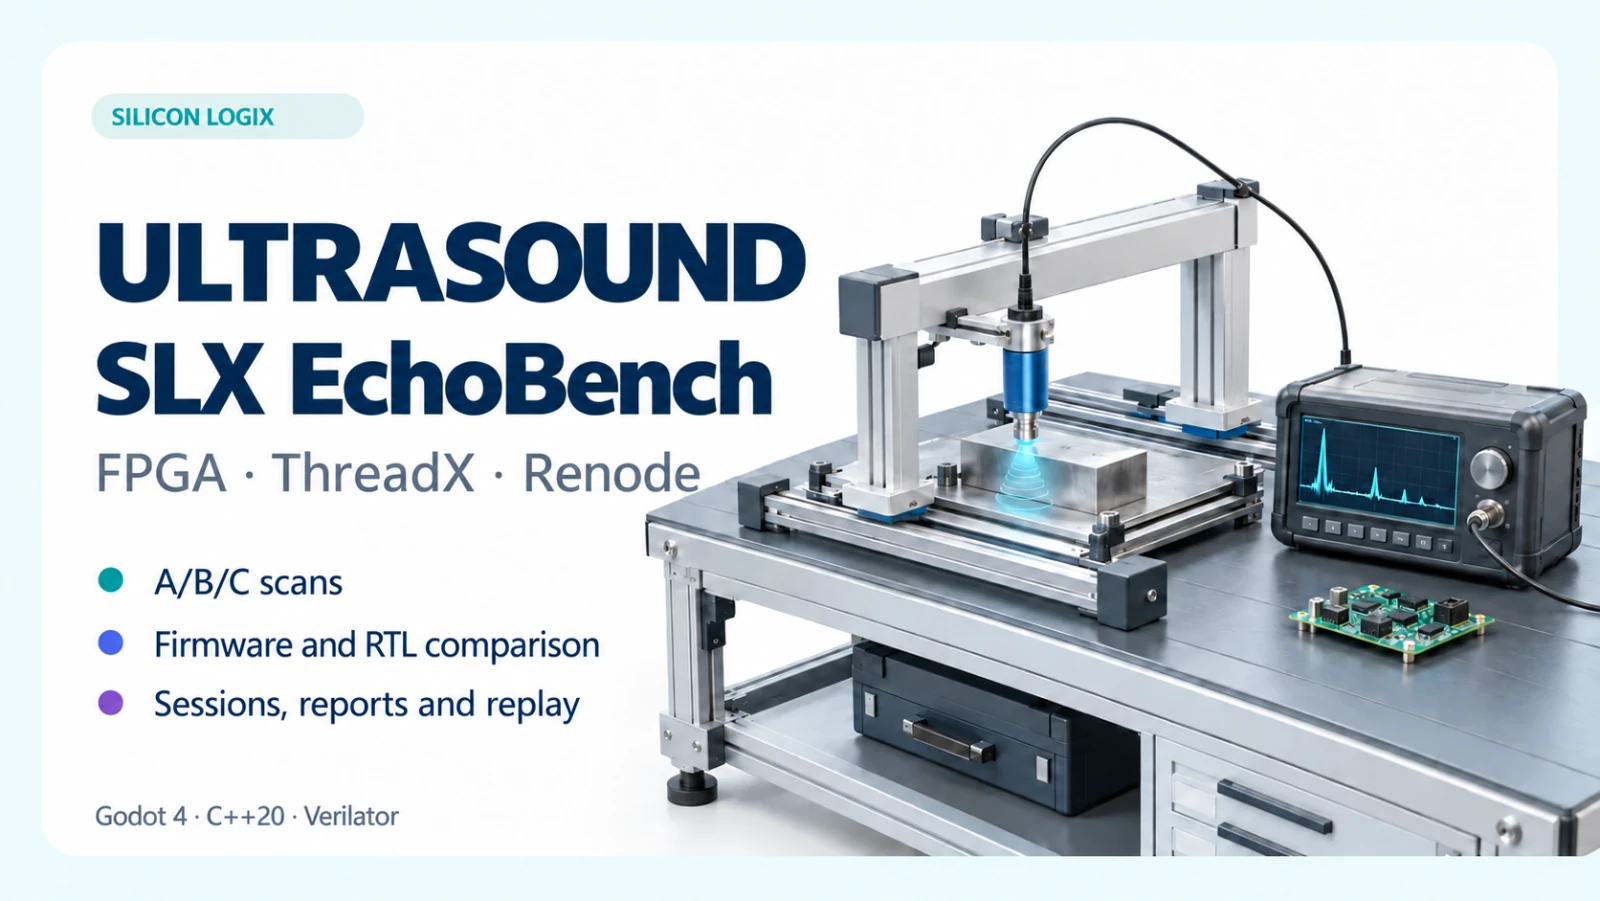
I built SLX EchoBench to make this problem explorable through a virtual ultrasonic inspection bench. Behind the 3D scene are a C++20 engine, ARM firmware running Eclipse ThreadX, the Renode emulation platform and a FIFO described in SystemVerilog and executed through Verilator. The project connects an operator interface, synthetic data and joint verification of firmware and digital logic. The Windows preview on GitHub runs offline.
FPGAs: building a data path in programmable logic
FPGA stands for Field-Programmable Gate Array: an integrated circuit whose logic resources and interconnections can be configured after manufacture. Registers, memories and combinational functions can implement dedicated digital paths, with multiple operations active in parallel. AMD's introduction to programmable logic explains this principle and its use in data processing.
In a measurement chain, an FPGA can receive samples from an analogue-to-digital converter, synchronise channels, manage buffers and process data through pipelines. Processor firmware can handle configuration, state management and higher-level decisions. The boundary between these responsibilities becomes part of the design: which data is ready, when it can be read and how errors are communicated.
The EchoBench model uses a nominal sampling rate of 25 million samples per second: one sample every 40 ns. This timescale helps explain why buffer capacity and flow control matter. The rate describes the synthetic signal; the speed at which a PC executes the demo is a separate measurement.
RTL and SystemVerilog: describing circuit behaviour
RTL, or Register Transfer Level, describes logic through registers, operations and transfers governed by a clock. Hardware description languages such as VHDL, Verilog and SystemVerilog express these circuits. Implementing them on an FPGA then requires synthesis, implementation and timing verification for the selected device.
EchoBench's RTL block is a synchronous FIFO holding 256 words of 16 bits, written in SystemVerilog. FIFO means First In, First Out: the first item written is the first available to read. Pointers, occupancy, availability signals and a dropped-data counter provide a small but meaningful example of a component used in acquisition paths.
Verilator compiles Verilog/SystemVerilog descriptions into executable C++ or SystemC models. EchoBench uses the compiled FIFO model in a native library: reset, writes, reads and overflow pass through that logic. This verifies RTL behaviour; the preview distributes an executable model rather than a bitstream for a physical FPGA board.
From the virtual bench to the ultrasonic signal
The scene represents an inspection bench with a movable probe and a reference specimen. The model implements a normal-beam pulse-echo measurement: it generates the pulse, reflector echoes and backwall echo, linking them to probe position and configuration. The demonstration specimen is 40 mm thick and contains three known reflectors.
Each acquisition contains 512 samples at 25 MS/s, with a nominal 5 MHz pulse. Gain, filtering, noise, attenuation and coupling let the operator explore changes in the signal and its usability. This is a simplified synthetic acoustic model, described in the architecture documentation: results apply within those assumptions and support development and discussion of the processing workflow.
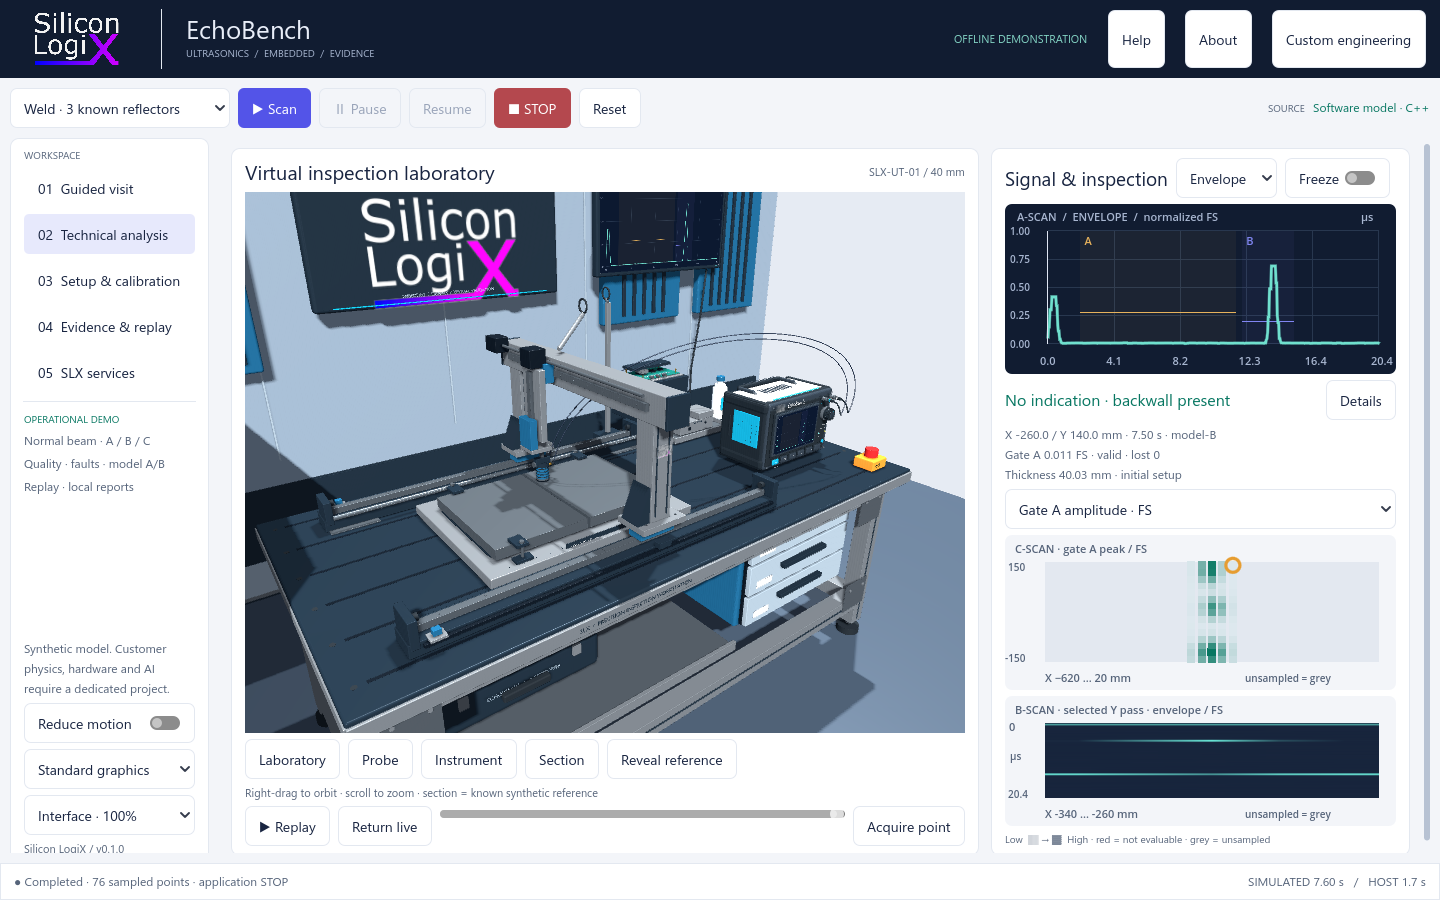
A-scan, B-scan and C-scan: reading the same acquisition
The A-scan shows the signal over time as RF or an envelope. Two time windows, called gates, define the regions of interest: in the included configuration, gate A looks for internal echoes and gate B observes the backwall echo. Amplitude, time of flight and estimated thickness remain associated with the position and configuration used to acquire the point.
The B-scan places envelopes side by side along the selected pass; the C-scan maps amplitude, thickness or acquisition quality onto the sampled surface. Scanning can be manual or follow a raster. The interface moves between the overall view and signal detail, lets the operator stop the experiment and returns to recorded points.
Data quality and the extent of the sampled path describe different aspects of the inspection. Insufficient coupling, saturation and sample loss can make a point not evaluable. The maps describe surface acquisitions in the model; an area traversed by the probe does not, by itself, establish ultrasonic coverage of the volume.
Known references and model calibration
The reference view reveals the synthetic reflectors inside the specimen. It connects the geometry to the observed echo, supports experiments with different positions and helps explain the cause of an indication. The geometric reference therefore keeps an explicit role throughout the experiment.
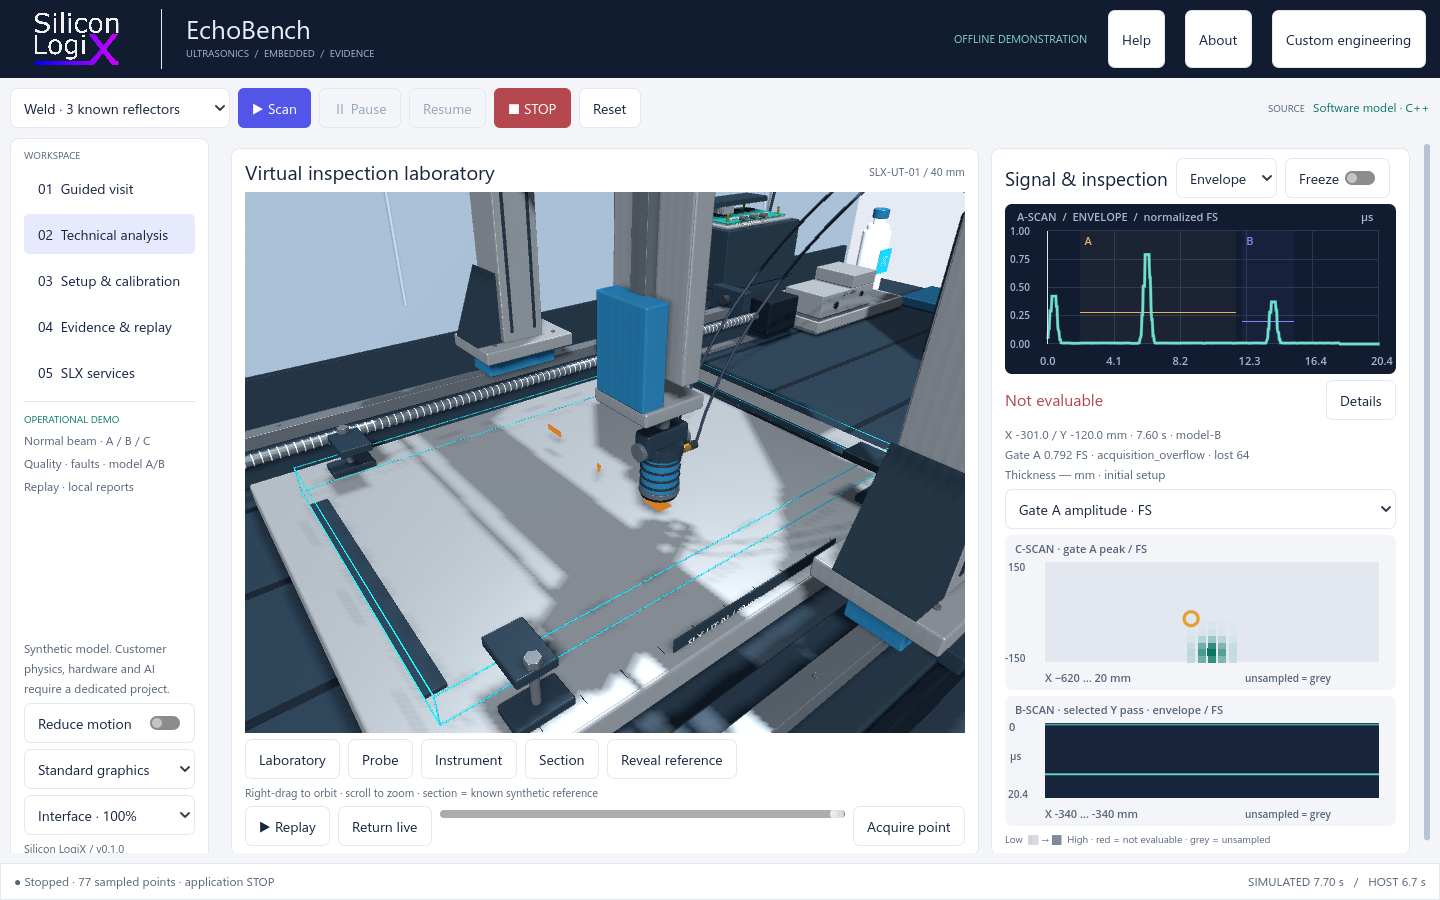
Setup & calibration includes two synthetic references, 20 and 40 mm, used to derive the model's velocity and time offset. Configuration and calibration are preserved with the results. This verifies software behaviour under the declared conditions; calibrating a physical instrument requires specific references, procedures and checks.
ThreadX and Renode: firmware inside the virtual platform
Eclipse ThreadX is an RTOS, a real-time operating system for embedded applications. It provides threads, scheduling, synchronisation and timing services. In EchoBench, an acquisition thread reads samples and peripheral status, finds the maximum within the gate and writes its result to a memory area shared with the test environment.
The two compiled ARM firmware builds execute in Renode on a virtual Cortex-M3 platform. The platform includes memory, a SysTick timer and an acquisition peripheral implemented in C#. The processor uses memory-mapped I/O, or MMIO, to access registers: COUNT gives the available sample count, DATA returns the next sample and FLAGS reports data loss.
In the RTL profile, the C# peripheral calls the FIFO library compiled with Verilator. This connects executed ARM instructions, register accesses and digital logic behaviour. The Renode peripheral modelling guide explains the general bus access mechanism; the EchoBench documentation describes the specific connection used in the demo.
The experiment: the same peak, different decisions
Both builds receive the same saved samples. In the included profile, the gate operates on Q15 samples at 0 dB with no filtering. Their difference is deliberate: A ignores the overflow admission check and can accept the remaining peak; B checks data completeness and rejects the incomplete acquisition. This makes a data-admission error observable even when the amplitude still looks plausible.
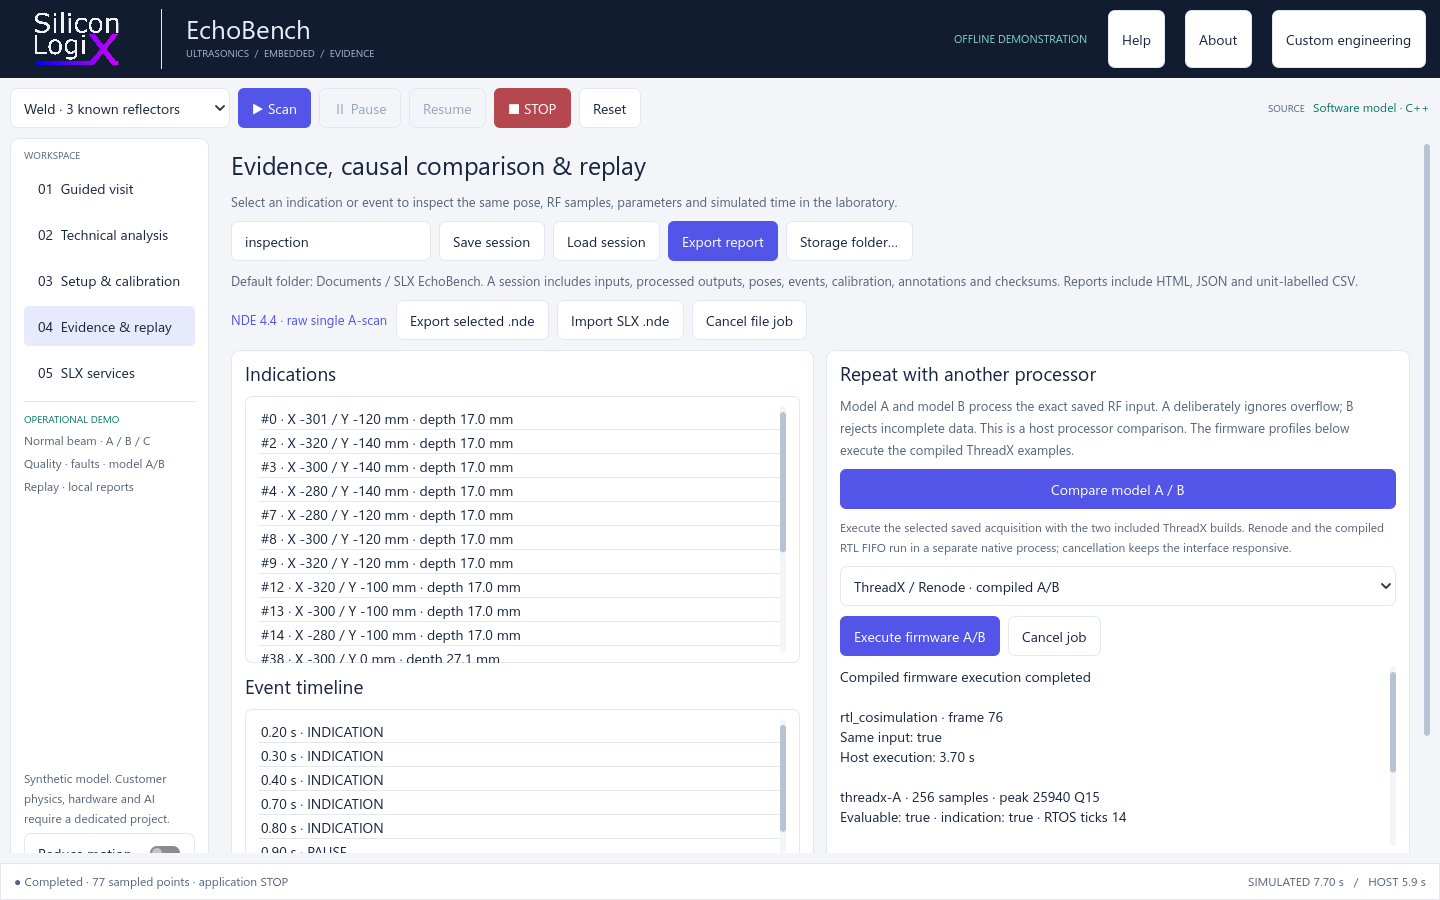
To reproduce the problem, the ThreadX + Verilator FIFO profile can attempt to write a burst of 512 words into a 256-word FIFO before reading its contents. It retains 256 words and counts 256 attempted writes as lost data. A peak in the retained portion can therefore survive the fault: A accepts it, while B also considers the loss flag and sample count. The host model fault has a separate contract and drops 64 samples.
The ready/valid signals also make this useful for FPGA developers. An input transfer is accepted when the producer presents valid data and the FIFO is ready to receive it. Readiness enables flow regulation through backpressure. The overflow test deliberately forces attempts while the queue is full and verifies that data-loss information reaches the firmware decision.
Firmware execution processes the single selected saved input; the raster acquisition and maps are handled by the host model. Results preserve hashes of the input, firmware and RTL, together with the ThreadX ticks actually observed. Timing and peripherals belong to the emulated platform and require dedicated validation before drawing conclusions about a physical board.
Godot and C++20: connecting the 3D bench to processing
The visible laboratory uses Godot 4.5 and GDScript for the 3D scene, operator controls and result inspection. The bench makes the relationship between probe position, configuration and signal easy to explore: moving the probe changes the model's data and the context in which it should be interpreted.
The C++20 engine manages the acoustic model, processing, sessions and emulation jobs. Interface and engine communicate through a local API using JSON messages; Renode runs as a separate process, with cancellation support. This keeps controls responsive during firmware comparison and preserves the input, configuration and outcome together.
Repeating experiments and preserving evidence
A session saves samples, probe poses, applied parameters, calibration, events and annotations. Replay selects an indication or event and restores its context without manually recreating the scan. This supports comparing a change, discussing a case and documenting the reason for a decision.
Reports can be exported as HTML, JSON and CSV with explicit units. Integrity checks and processing provenance help maintain the connection between data and results. The verification documentation records the checks performed and the limits of their conclusions.
Data exchange: the included NDE 4.4 subset
EchoBench implements a documented mapping of the NDE 4.4 format: the public dataset contains one selected raw A-scan, with dimensions 1 x 1 x 512. The complete native session is preserved in the vendor extension, together with the information needed to restore it.
Validation includes the official schemas and exact recovery of samples and session data. Import and export apply to this specific SLX mapping. Integrating other instruments' files, volumetric datasets or DICONDE requires dedicated adapters and interoperability tests.
Trying the Windows preview
Download the portable Windows x64 package from release v0.1.0-preview, extract the complete archive and launch EchoBench.exe, keeping the included folders and resources alongside it. The guided visit introduces the bench; Technical analysis opens signals and maps; Evidence & replay provides sessions and firmware comparison.
The slx-echobench GitHub repository includes the Godot/GDScript interface, API contracts, documentation and examples. The proprietary C++20 engine is distributed as a binary SDK. The project uses the Silicon LogiX Evaluation License 1.0; evaluation purposes and usage conditions are specified in the licence.
From the demo to a custom engineering project
EchoBench provides a concrete starting point for discussing acquisition requirements, error handling, operator interfaces and repeatable tests. Moving to an industrial system starts with real data, the measurement chain and the customer's acceptance criteria.
Commissioned work can include firmware and drivers, FPGA logic and acquisition paths, desktop software, instrument connectivity, hardware-in-the-loop benches and production system integrations. PAUT, TFM and TOFD techniques, qualified acoustic models, robotics and AI analysis require specific development and validation and are extensions to define within a project.
Are you developing an acquisition system or an inspection bench? Tell me about your project: the probe or sensor, available electronics, sampling rate, data format and critical case to reproduce. These are the starting points for a useful, measurable experiment.
Frequently asked questions
Do I need a probe or an FPGA board to try EchoBench?
The included preview runs offline on Windows x64 with a synthetic bench and signals. Firmware and FIFO RTL execute in the virtual environment distributed with the package.
Can the program qualify an inspection on a real component?
The demo explores and verifies the software workflow within the declared model. Qualifying an NDT procedure, characterising real flaw responses and calibrating an instrument require physical experiments and dedicated criteria.
Does the A/B comparison actually execute firmware?
Yes. The firmware execution command runs the ARM ThreadX binaries in Renode on the selected saved point. A separate comparison of the host model processors is also available; the interface distinguishes the two paths.
Can I import any .nde file?
The initial version imports files that follow the SLX single-A-scan NDE 4.4 mapping. Other manufacturers and data layouts require compatibility assessment and an adapter.
Technical references and further reading
The official references and preview documentation below provide more detail about the technologies and project decisions:
- AMD - The Programmable Logic Advantage: introduction to FPGAs, programmable logic and reconfigurable architectures, page 5.
- Verilator - Overview: from Verilog/SystemVerilog descriptions to compiled executable models.
- Eclipse ThreadX RTOS: the official project, kernel services and embedded architecture ports.
- Renode - Peripheral modelling guide: virtual peripherals, registers and processor bus accesses.
- Renode - Co-simulating with an HDL simulator: further reading on connecting emulated platforms and HDL models.
- Godot 4.5 - Introduction to Godot: the 2D/3D engine, applications and supported languages.
- NDE 4.4 and the EchoBench NDE mapping: the exchange format and the implemented subset.
- EchoBench architecture, local API and verification and limitations: component contracts, responsibilities and experiment conditions.